The Knowledge Graph
How five industries that share nothing in common arrived at the same architecture
Sometime around 2014, an engineer at NASA stopped trusting his own archive. The agency had been writing down what it learned since the late 1950s – every mission, every failure, every contaminated valve and ruptured seal and software defect that almost killed someone. By the time David Meza inherited the system as Chief Knowledge Architect, it held more than ten million documents. The information was all there. It was just impossible to find. A keyword search returned thousands of results in random order, and engineers, who have better things to do than read thousands of documents in random order, had stopped using it.
Meza eventually rebuilt the archive as a graph. Every lesson became a node. Every cause, consequence, and shared component became an edge connecting it to other lessons. An engineer working on Juno could now traverse, in seconds, the lineage of decisions made on Galileo and the Mars Reconnaissance Orbiter – and surface non-obvious connections, like the one Meza famously found between fluid valve contamination and battery fire risk, that no flat search would ever have produced.
While he was doing this, other people in completely unrelated fields were doing the same thing. Investigative journalists in 76 countries were rebuilding 11.5 million leaked offshore documents as a graph to follow ownership chains across jurisdictions. Pharmaceutical researchers were doing it to genes, proteins, and clinical outcomes. Banks were doing it to the chain of every figure they reported to regulators. Transport for London was doing it to 65,000 roads, in real time, to keep the city moving. None of these groups were talking to each other. They arrived at the same answer independently, because the answer was the same problem rotated five times.
The answer is called a knowledge graph. The structure is simple.
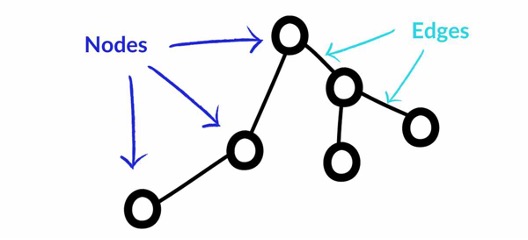
Things are nodes, relationships are edges, and the relationships are stored as data in their own right – not reconstructed each time you need them, the way they would be in a spreadsheet or a relational database. The implication is large. Once the connections are first-class data, you can ask questions that are essentially impossible otherwise: trace a single change through every consequence it produces; surface a relationship between two entities that no individual record contains; simulate the behavior of a whole network before touching anything in the real world. None of these are features that can be added to a database that wasn’t built this way. They are properties of the graph itself.
The five cases below are the most well-documented examples of this convergence. Each is in a different industry. Each was solved by a different organization, using a different team, against different constraints. The technical answer was the same.
NASA – three decades of mission knowledge, finally addressable
Meza’s graph started this post, and it is worth lingering on the technical move. The original system was a document repository: keyword in, list of links out. The graph version is structurally different. Topics are clustered using machine learning, then linked to the lessons that touch them, then linked to the programs that produced those lessons, then linked to the components those programs shared with later programs. An engineer asking a question about a specific subsystem on a specific spacecraft can pull, in one query, every related lesson from every adjacent program over six decades of agency history. The technology behind it is Neo4j. The intellectual move is the same one the other four cases make: stop treating the documents as the unit of knowledge and start treating the relationships as the unit of knowledge. Full article
AstraZeneca – a unified biological model for drug discovery
AstraZeneca’s Biological Insights Knowledge Graph (BIKG) integrates public scientific databases, NLP-extracted relationships from full-text literature, and proprietary AstraZeneca experimental data into a single graph of genes, proteins, diseases, compounds, and clinical outcomes. The result is that researchers can identify novel drug targets and predict efficacy by traversing the graph rather than by manually integrating siloed datasets, which used to take weeks. The architecture is now foundational across the company’s R&D pipeline. AstraZeneca published the framework openly, and the published statement of intent is worth reading: the value, in their words, is not in the graph itself but in what becomes possible once one exists. Full Article
ICIJ – a Pulitzer Prize, won by traversing a graph
The Panama Papers leak gave the International Consortium of Investigative Journalists 11.5 million documents and 2.6 terabytes of raw data, covering 350,000 offshore entities across 200 countries. No journalist could read it. No keyword search could find what mattered. ICIJ ingested the entire corpus into a Neo4j graph, modeling people, companies, intermediaries, and addresses as connected nodes. Reporters in 76 countries traversed the graph to follow ownership chains across jurisdictions – work that had been physically impossible at that scale before. The investigation won the 2017 Pulitzer Prize for Explanatory Reporting. Subsequent leaks (Paradise Papers, Pandora Papers) used the same architecture, because the architecture was the part that worked. Full Article
UBS – data lineage at regulatory scale
Every figure a global bank reports to a regulator must be traceable back through the chain of systems, models, and source data that produced it. At a bank like UBS, this chain crosses thousands of systems and millions of data points. UBS rebuilt the lineage as a knowledge graph – a structured map of how every reported number was derived, which inputs feed which models, and where any change propagates downstream. Audit trails that had previously taken analyst-weeks to assemble are now produced in seconds. The same architecture underlies the bank’s fraud detection: the connections between accounts, devices, and transactions are precisely what reveal coordinated activity that no individual record exposes. Full Article
Transport for London – a digital twin of a city in motion
Transport for London manages 65,000 roads and a transit network used by nine million residents. The city experiences roughly 20,000 unplanned transport incidents a year, and under the previous system, detection took 14 to 17 minutes per incident — by which point an average of 27 minutes of traffic had built up. TfL rebuilt the network as a Neo4j-backed digital twin: every road, junction, signal, and transit link is a node; every flow, dependency, and incident is a relationship. Operators can now simulate how a single incident propagates across the network and test interventions before deploying them. Congestion costs London roughly £5 to £7 billion a year in lost productivity. The graph is the layer that makes managing it tractable. Full Article
The convergence is the argument
There is no scientific reason a spacecraft engineer, a drug researcher, an investigative journalist, a regulatory officer, and a transport operator should ever arrive at the same architectural answer. They work in different buildings, attend different conferences, read different journals, and would have nothing to say to each other at a dinner. And yet, when each of them sat down with a system whose value lived in its connections, and tried to build the tool they actually needed, they all built the same thing.
That is the argument worth taking seriously. It is not that any single one of these cases proves a knowledge graph is the right answer for some other domain. It is that across an unusually wide range of human work – spaceflight, biology, document forensics, financial regulation, urban infrastructure – every operator who has tried to manage a system of dense, evolving, interdependent relationships at scale has eventually rebuilt the data as a graph. The convergence is what tells you the architecture is correct. It is the same kind of evidence as the convergence on tabular spreadsheets in finance, or on relational databases for transactional records: when the same answer keeps emerging from independent attempts to solve the same structural problem, it stops being a choice and starts being the choice.
The argument for real estate development
Real estate development – and the development of large data centers in particular – has every characteristic that drove the five cases above to a graph. The information that matters is dense, evolving, and almost entirely about relationships. A site is not a piece of land. It is the joint state of land, power, regulation, capital, team, and timeline, and a change in any one of them propagates to all the rest. The standard tools for managing this work – spreadsheets, document management systems, project management software – model individual entities reasonably well and the connections between them barely at all. The result is what the industry has lived with for decades: stale plans, lost institutional memory, projects executed against partial pictures of their own state.
A development project is already a graph. The land has properties; the power has constraints; the regulations apply to specific entities under specific conditions; the team has a track record; the capital structure depends on all of it. Every one of those is a node. Every dependency is an edge. The work that experienced developers do today – holding the entire state of a project in mind across a four-to-six-year build, propagating consequences across domains, recovering institutional memory that lived only in someone’s head – is exactly the work that the knowledge graph was built to do. The fact that the industry has not yet adopted the architecture is not a verdict on the architecture. It is a verdict on the industry.
NASA built one for missions. AstraZeneca built one for molecules. ICIJ built one for offshore companies. UBS built one for transactions. Transport for London built one for a city. Sandbox is building one for the development of the physical world around us.